
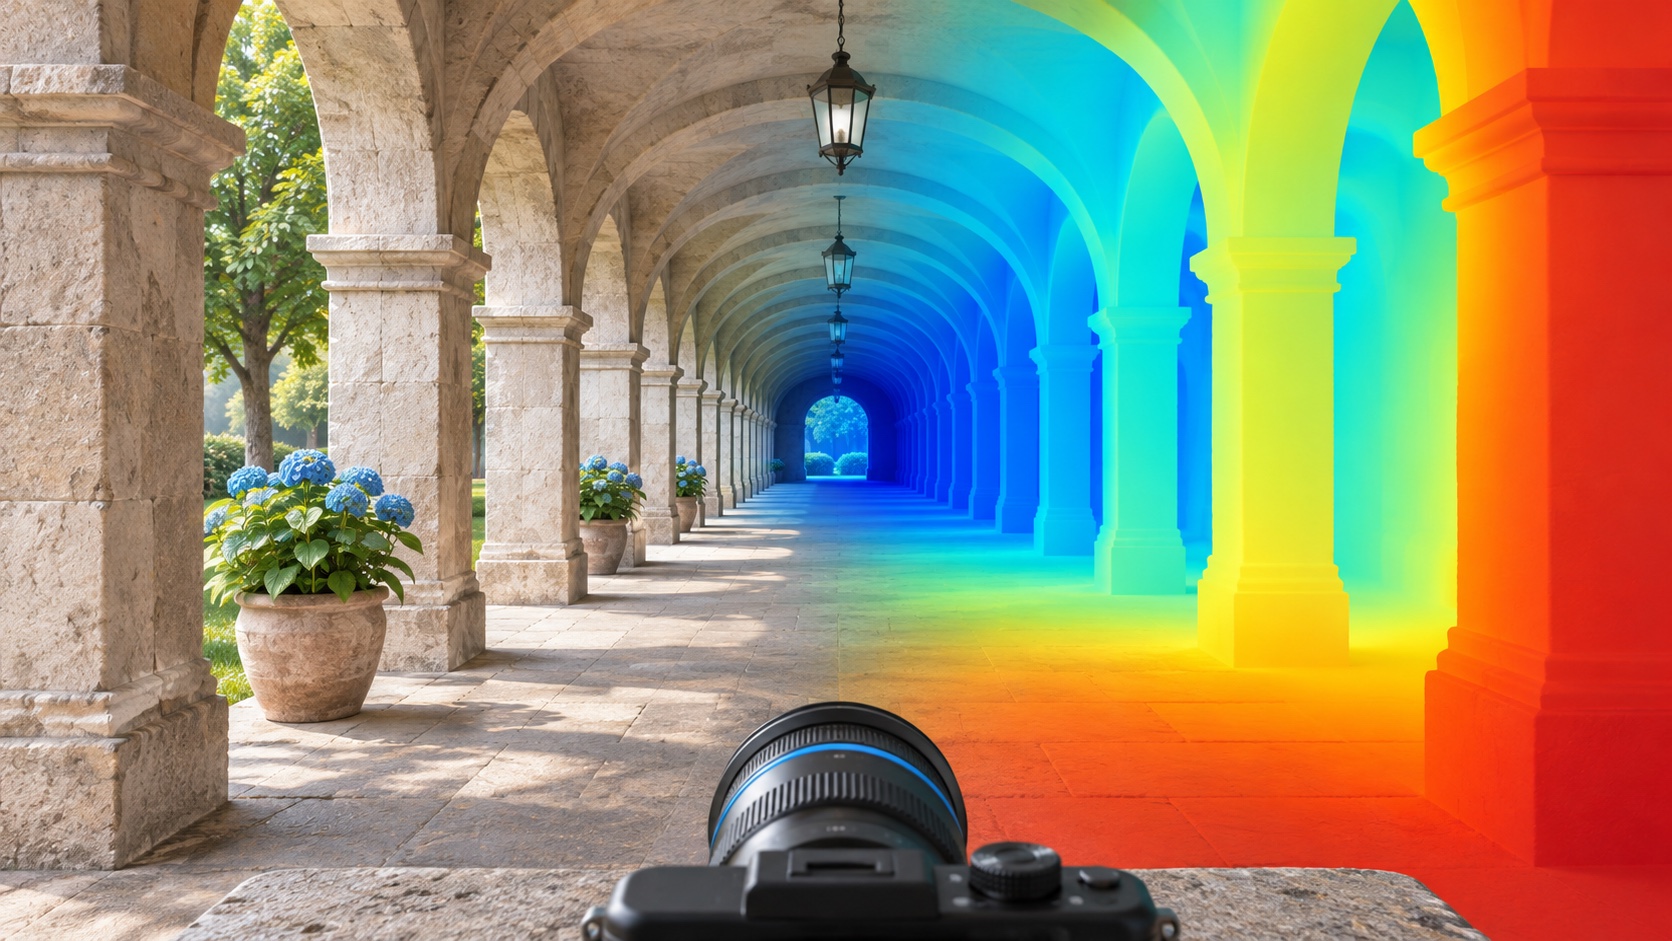
A depth map can look like a convincing relief of a scene. That visual impression is useful, but it does not tell us whether its values are in metres, whether two objects have the correct relative size, or whether the geometry is accurate enough for documentation.
Before using a predicted depth map, I would ask which of those claims the model and its evaluation actually support.
Research context
Our paper Monocular Depth Estimation: A Thorough Review, by Vasileios Arampatzakis, George Pavlidis, Nikolaos Mitianoudis and Nikos Papamarkos, surveys the problem through human depth perception and deep-learning approaches. IEEE records first online publication on 8 November 2023; the final journal placement is TPAMI 46(4), pages 2396–2414, April 2024. The institutional repository corroborates the online date. The calculation below is an independent illustration of scale ambiguity and evaluation, not a result from a depth-estimation benchmark.
Why scale can disappear in projection
In a simple pinhole model, a horizontal image coordinate is:
Scaling both X and Z by the same positive factor leaves their ratio unchanged. A larger object further away can therefore have the same projected size as a smaller object nearby. Additional information or learned assumptions are needed to resolve physical scale.
A model trained on metric data can learn useful scale cues, but that does not remove the need to evaluate those cues under the conditions where the model will be used. A change of camera, scene type or acquisition process may change their reliability.
Relative depth and metric depth answer different questions
Relative depth may indicate which surface is nearer or how a scene is shaped up to an unknown scale. Metric depth makes a stronger claim about physical distances. If the application is visual exploration, relative structure may be sufficient. If it is a dimensional measurement or comparison over time, scale and uncertainty become central.
This distinction also matters when a predicted depth map is converted into a point cloud. A dense point cloud is still an estimate. Point count does not establish traceable dimensional accuracy.
A perfect shape can have a large metric error
Take four true depths of 1, 2, 4 and 8 metres. Suppose the predictions are 2, 4, 8 and 16. Every predicted value is twice the correct value. The relative structure is exact, but the metric scale is wrong.
One common scale-sensitive error is the mean absolute relative error:
Here it equals 1. Multiplying the predictions by 0.5 makes it zero. If that factor was estimated using the ground-truth depths of the evaluated scene, the aligned score evaluates shape after access to scale information. It is not evidence that the model recovered metric scale on its own.
truth = np.array([1., 2., 4., 8.])
prediction = 2 * truth
absrel = lambda p: np.mean(np.abs(p - truth) / truth)
scale = np.median(truth) / np.median(prediction)
print(absrel(prediction), absrel(scale * prediction))  # 1.0, 0.0
What a scale-invariant score hides
For positive depths, log residuals separate a multiplicative scale error from changes in shape. In this example all log residuals equal log 2. Subtracting their mean removes that common offset, leaving zero residual variance.
That is the intended behavior of a scale-invariant comparison. It is also why a good scale-invariant score cannot, by itself, justify a metric measurement claim. The evaluation protocol should say whether alignment was used and how its parameters were estimated.
Mask invalid values explicitly
A depth evaluation must define valid ground truth, predicted ranges and the evaluation region. Logarithms require positive values. Missing ground truth should not be treated as a true depth of zero, and invalid predictions should not simply be dropped without reporting how many were excluded.
For a real comparison I would report the valid pixel fraction, the alignment convention, scale-sensitive and relevant scale-invariant metrics, and visual error maps. I would also inspect boundaries, reflective or textureless surfaces and failure cases in the target domain.
Use the estimate at the right level of evidence
Monocular depth can support scene understanding and exploratory 3D workflows. A preservation measurement needs an appropriate reference, calibration and uncertainty assessment. The useful question is not whether a depth map looks three-dimensional, but whether its errors have been measured against the decision it is intended to support.
Complete reproducible example
This standalone example uses fictional data or prescribed mathematical objects; it is not a reproduction of the source paper’s experiments.
"""Synthetic depth evaluation; alignment uses ground truth deliberately."""
import json
import numpy as np
truth=np.array([1.,2.,4.,8.]); prediction=2*truth
absrel=lambda p: float(np.mean(np.abs(p-truth)/truth))
scale=float(np.median(truth)/np.median(prediction))
log_residual=np.log(prediction)-np.log(truth)
centered_log_variance=float(np.mean((log_residual-log_residual.mean())**2))
assert np.isclose(absrel(prediction),1.)
assert np.isclose(absrel(scale*prediction),0.)
assert np.isclose(centered_log_variance,0.)
print(json.dumps({"raw_absrel":absrel(prediction),"ground_truth_derived_scale":scale,"aligned_absrel":absrel(scale*prediction),"centered_log_variance":centered_log_variance},indent=2))