
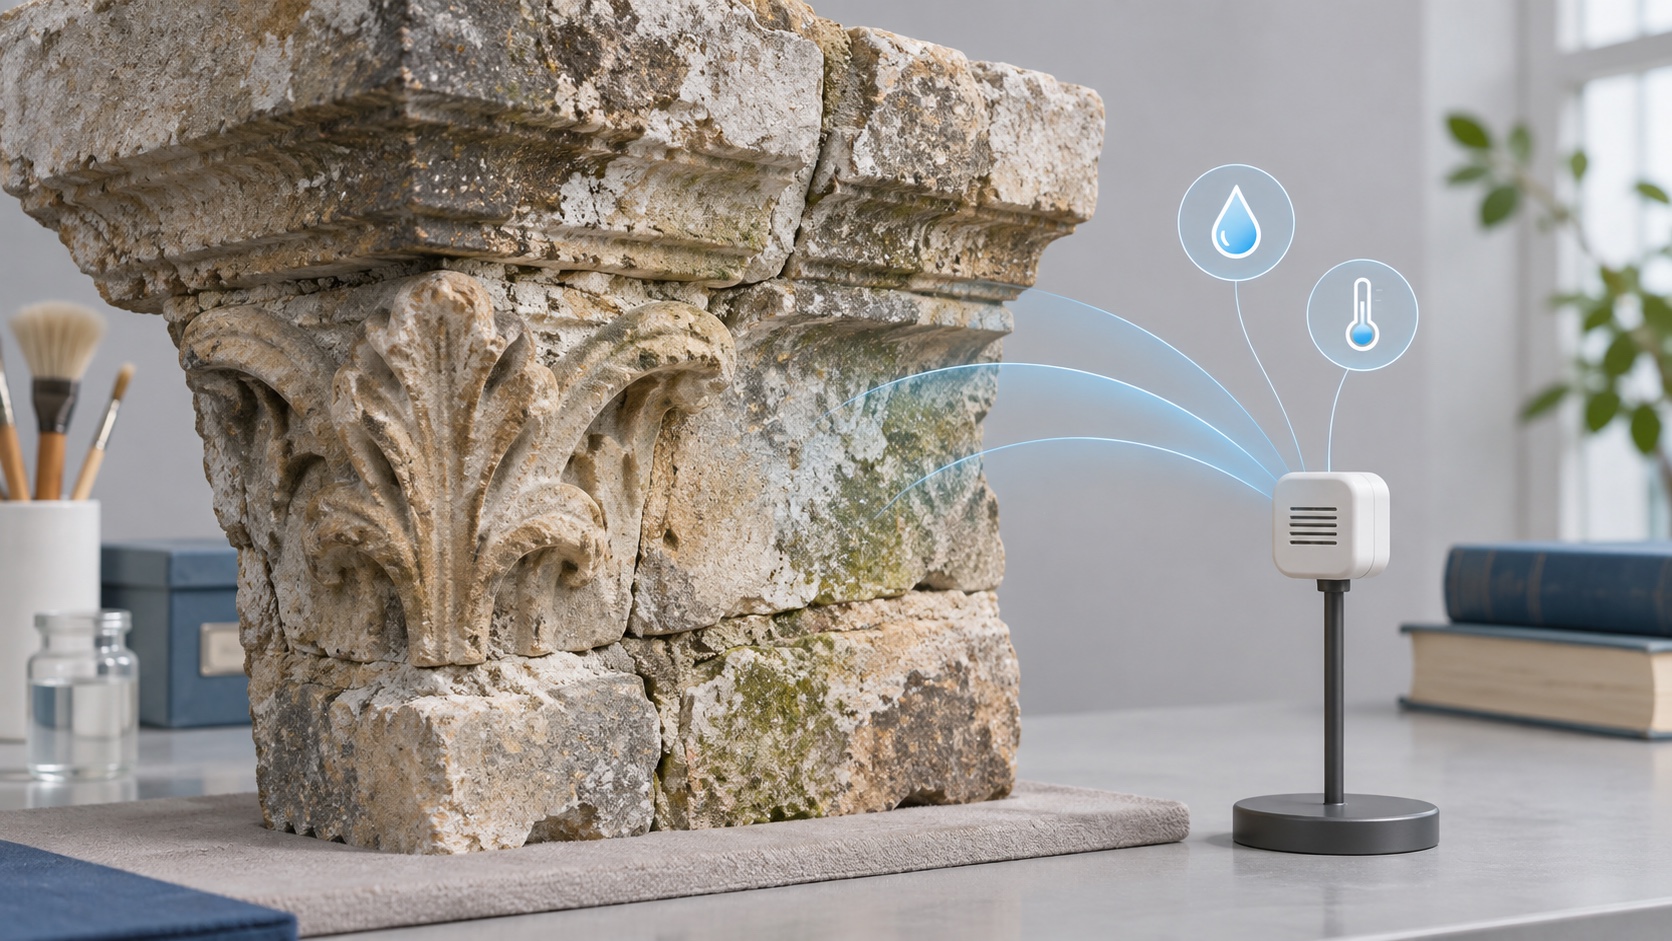
A sensor installation can produce a very large dataset and still fail to answer a conservation question. The missing step is often the link between the damage mechanism we care about and the quantity the device actually observes. Before choosing a product, I would write down that link.
Research context
Our paper Sensor-Driven Preventive Preservation in Remote Built Heritage: A Threat-to-Sensor Approach, led by George Pavlidis with colleagues from Athena RC, CSIC, Eurecat and Worldsensing, describes ARGUS’s risk-informed sensor selection for remote heritage sites. Its repository dates publication to September 2025; it belongs to IEEE-CH, held 8–10 September 2025. It discusses heterogeneous sensing, communications, installation and pilot experience. This tutorial develops an independent planning and data-quality example; its thresholds and readings are fictional, not ARGUS measurements or conservation limits.
Work backwards from the decision
Consider a decorated wall in a building that cannot be visited daily. “Install a humidity sensor” leaves several questions unanswered. Are we investigating condensation at the surface, moisture movement within the material, seasonal environmental exposure, or conditions favourable to biological growth? Those mechanisms need different evidence.
The useful chain is: preservation question, plausible mechanism, observable quantity, measurement location, sampling interval, interpretation, and response. The response matters because an alert without an owner or an achievable action may only accumulate unread messages.
| Question | Possible evidence | Interpretation limit |
|---|---|---|
| Are environmental conditions changing rapidly? | Air temperature and relative humidity | An air reading is not wall moisture content |
| Is a crack changing? | A suitable displacement measurement with temperature context | Instrument drift and thermal movement need assessment |
| Is a location repeatedly exposed to water? | Moisture observations, rainfall context and inspection | A nearby weather station may not describe local ingress |
This table is a planning aid, not a prescription for a particular monument. Installation must also respect the fabric of the asset and the authority responsible for it.
Sampling is part of the instrument
Suppose readings are scheduled every fifteen minutes. A brief event lasting five minutes may occur entirely between samples. Taking an average of the available readings does not recover that missing event. Increasing sampling frequency has costs in power, communications and storage, so the interval should follow the process and the response time required.
For a regular schedule, a simple completeness measure is:
The denominator must refer to the same time window and schedule. If a device deliberately sleeps overnight, counting those hours as failed observations would give a misleading result. Conversely, silently excluding an outage inflates completeness.
Missing data can create a reassuring average
Take this synthetic sequence of twelve expected relative-humidity readings:
readings = [61, 62, None, 65, 68, 72,
            None, 74, 73, 70, 67, 64]
valid = [x for x in readings if x is not None]
completeness = len(valid) / len(readings)
mean_available = sum(valid) / len(valid)
print(completeness, mean_available)
Ten readings arrived, so completeness is 83.33%. The mean is 67.6 for the available values. Neither number tells us what happened during the two gaps. Replacing missing values with zero would lower the mean without any physical justification.
A rolling statistic should retain its support count. With a three-slot window containing two missing entries, the one remaining reading is not a robust three-observation average. The accompanying code returns no rolling mean unless at least two readings are present. That minimum is an explicit teaching choice, not a validated alert rule.
Separate data quality from preservation concern
A communication outage and an environmental change can both require attention, but they are different events. I would keep separate statuses for a missing device, an implausible measurement, a sustained threshold crossing and an expert-confirmed concern. That makes it possible to ask whether a warning came from the environment or from the monitoring system itself.
For a real installation, I would test time synchronization, units, calibration records, battery decline, local buffering and recovery after loss of connectivity. I would also record the measurement’s location and its relationship to the heritage feature. A device ID alone is not enough when equipment is moved.
Close the loop with people
The final output should be an inspectable observation and a proportionate next step: review the chart, compare nearby instruments, inspect the location, or arrange a visit. Automated rules can prioritize attention. Material diagnosis and intervention still require the relevant expertise and authorization.
The practical success criterion is not the number of sensor types installed. It is whether the measurements can support a defensible decision, with their gaps and limitations visible.
Complete reproducible example
This standalone example uses fictional data or prescribed mathematical objects; it is not a reproduction of the source paper’s experiments.
"""Fictional regular-slot observations; thresholds are teaching choices."""
import json
x = [61, 62, None, 65, 68, 72, None, 74, 73, 70, 67, 64]
valid = [v for v in x if v is not None]
rolling = []
for end in range(2, len(x)):
    window = [v for v in x[end-2:end+1] if v is not None]
    rolling.append(sum(window)/len(window) if len(window) >= 2 else None)
assert len(valid) == 10
assert abs(sum(valid)/len(valid) - 67.6) < 1e-12
print(json.dumps({"completeness":len(valid)/len(x), "mean_available":sum(valid)/len(valid), "three_slot_means_min_two":rolling}, indent=2))