Just a few days ago I run into a very interesting image processing challenge at StackOverflow. The challenge focused on the detection of a christmas tree in an image (see here for more info).
Since I had a some free time I though I could give it a try… The rules in this challenge were plain and simple and included a dataset of 6 images to be used in all experimentation.
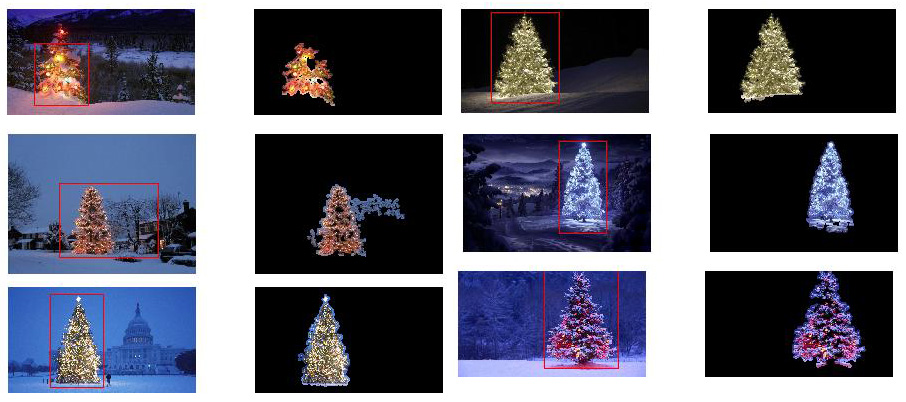
My first approach was based on the assumption that images depict lighted trees on typically darker and smoother backgrounds (or foregrounds in some cases). The lighted tree area is more “energetic” and has higher intensity. So I converted images to grayscale, applied a Laplacian of Gaussian filter to enhance the ‘energetic’ areas of the image and then thresholded it to get only the most significant parts. since these parts were mostly single pixels scattered across the image plane I had to connect them together to form larger areas by using morphological operations, specifically, dilation. This resulted in a binary mask image with true values in areas on interest and false values in ‘background’ areas.
This approach was somehow successful but not to satisfactory. Here I have some results:

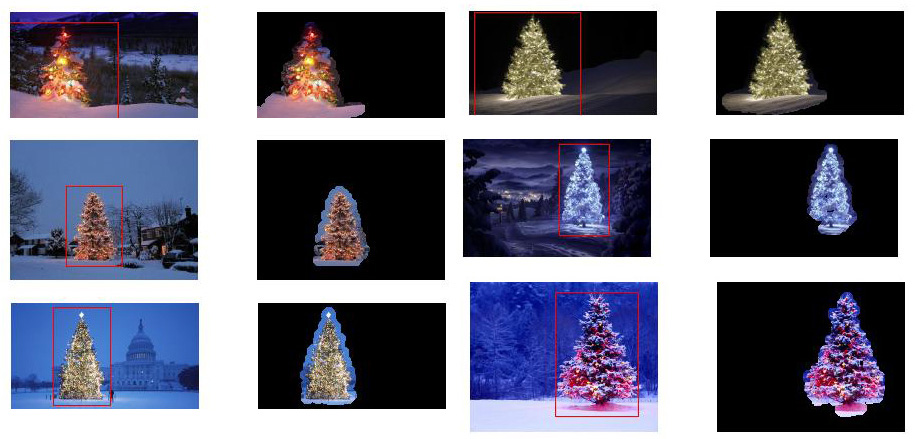
Then I tried another approach that did not convert to grayscale, but rather, exploited color information in the image. A first step was to convert to the HSV colorspace to decouple Hue, Saturation and Intensity. Then it was possible to discard everything with Hues (H) between 210 – 320 degrees (as being blue-magenta that is supposed to be in the background or in non-relevant areas), and everything with Values (V) lower that 40% (as being too dark to be relevant). This created a binary mask which had to undergo, again, morphological dilation to connect disconnected areas. Small areas and horizontal blocks (remember trees are vertical blocks) were discarded as irrelevant. This process gave a little better results but, again, not perfect. Here they are:

By looking at the results in both approaches I got the idea to somehow merge them into a new one. So my third and final proposal for the solution of this challenge was based both on HSV processing and LoG filtering. At the heart of this approach is the combination of three key assumptions:
- Images should have high fluctuations in the tree regions
- Images should have higher intensity in the tree regions
- Background regions should have low intensity and be mostly blue-ish
With these assumptions in mind the method works as follows:
- Convert the images to HSV
- Filter the V channel with a LoG filter
- Apply hard thresholding on LoG filtered image to get ‘activity’ mask A
- Apply hard thresholding to V channel to get intensity mask B
- Apply H channel thresholding to capture low intensity blue-ish regions into background mask C
- Combine masks using AND to get the final mask
- Iteratively dilate the mask to enlarge regions and connect dispersed pixels
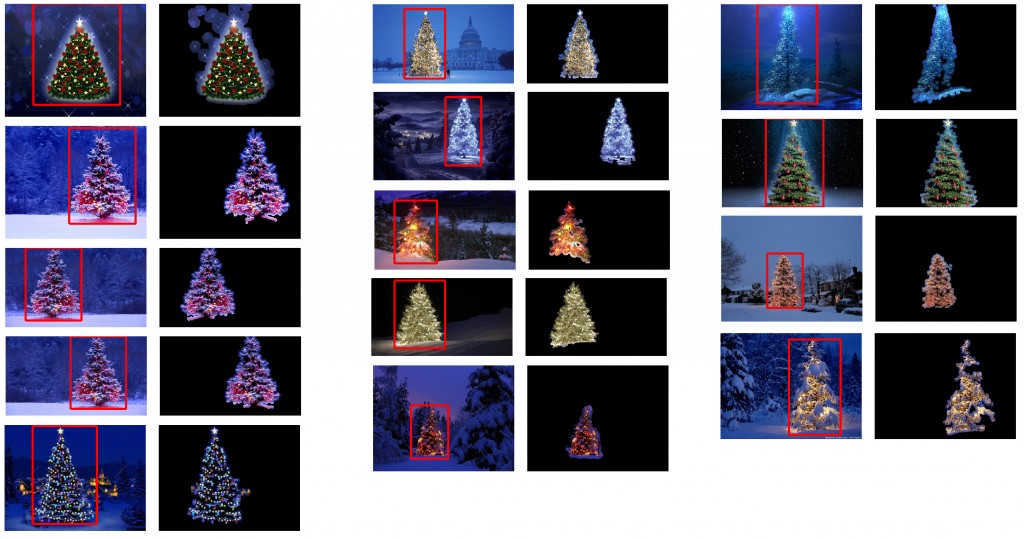
- Eliminate small regions and get the final mask which will eventually represent only the tree
This method produced excellent results and I had to put it to the test using even more images to check its robustness. Here are the final results:

The method was tested using MATLAB and here is the code on how to do the trick (remember the code is far from being optimized!!! I used techniques not recommended for MATLAB programming just to be able to track anything in the process – this can be greatly optimized) – the script loads all .jpg images in the current folder, detects christmas trees and outputs the results:
% clear everything
clear;
pack;
close all;
close all hidden;
drawnow;
clc;

% initialization
ims=dir('./*.jpg');
imgs={};
images={};
blur_images={};
log_image={};
dilated_image={};
int_image={};
back_image={};
bin_image={};
measurements={};
box={};
num=length(ims);
thres_div = 3;

for i=1:num,
	% load original image
	imgs{end+1}=imread(ims(i).name);

	% convert to HSV colorspace
	images{end+1}=rgb2hsv(imgs{i});

	% apply laplacian filtering and heuristic hard thresholding
	val_thres = (max(max(images{i}(:,:,3)))/thres_div);
	log_image{end+1} = imfilter( images{i}(:,:,3),fspecial('log')) > val_thres;

	% get the most bright regions of the image
	int_thres = 0.3*max(max( images{i}(:,:,3)));
	int_image{end+1} = images{i}(:,:,3) > int_thres;

	% get the most probable background regions of the image
	back_image{end+1} = images{i}(:,:,1)>(150/360) & images{i}(:,:,1)<(320/360) & images{i}(:,:,3)<0.5;

	% compute the final binary image by combining
	% high 'activity' with high intensity
	bin_image{end+1} = logical( log_image{i}) & logical( int_image{i}) & ~logical( back_image{i});

	% apply morphological dilation to connect distonnected components
	strel_size = round(0.01*max(size(imgs{i})));		% structuring element for morphological dilation
	dilated_image{end+1} = imdilate( bin_image{i}, strel('disk',strel_size));

	% do some measurements to eliminate small objects
	measurements{i} = regionprops( logical( dilated_image{i}),'Area','BoundingBox');

	% if there are identified many small object apply another dilation
	while length(measurements{i})>14 && strel_size<(min(size(imgs{i}(:,:,1)))/2),
		strel_size = round( 1.5 * strel_size);
		dilated_image{i} = imdilate( bin_image{i}, strel('disk',strel_size));
		measurements{i} = regionprops( logical( dilated_image{i}),'Area','BoundingBox');
	end

	for m=1:length(measurements{i})
		if measurements{i}(m).Area < 0.05*numel( dilated_image{i})
			dilated_image{i}( round(measurements{i}(m).BoundingBox(2):measurements{i}(m).BoundingBox(4)+measurements{i}(m).BoundingBox(2)),...
				round(measurements{i}(m).BoundingBox(1):measurements{i}(m).BoundingBox(3)+measurements{i}(m).BoundingBox(1))) = 0;
		end
	end
	% make sure the dilated image is the same size with the original
	dilated_image{i} = dilated_image{i}(1:size(imgs{i},1),1:size(imgs{i},2));
	% compute the bounding box
	[y,x] = find( dilated_image{i});
	if isempty( y)
		box{end+1}=[];
	else
		box{end+1} = [ min(x) min(y) max(x)-min(x)+1 max(y)-min(y)+1];
	end
end

for i=1:num,
	figure;
	subplot(121);
	colormap gray;
	imshow( imgs{i});
	if ~isempty(box{i})
		hold on;
		rr = rectangle( 'position', box{i});
		set( rr, 'EdgeColor', 'r');
		set( rr, 'LineWidth', 3);
		hold off;
	end
	subplot(122);
	imshow( imgs{i}.*uint8(repmat(dilated_image{i},[1 1 3])));
	% maximize the window if needed
	%set(gcf, 'Position', get(0,'Screensize'));
	% save figures as image files if needed
	%print(gcf,'-dpng',sprintf('result_0%d.png',i));
end


Very interesting, thanks for the post.