
Definition
Typically, three Pythagorean means are defined and constitute the classical means used in various scientific fields; they are the arithmetic mean, the geometric mean, and the harmonic mean. Pythagoreans are reported to have first studied these means, along with later generations of Greek mathematicians, and this is why the means got the name ‘Pythagorean’.
In terms of a formal definition, for a vector of values ![x_i,\, i=[1,N]](https://s0.wp.com/latex.php?latex=x_i%2C%5C%2C+i%3D%5B1%2CN%5D&bg=ffffff&fg=000&s=0&c=20201002)
Arithmetic mean:

Geometric mean:
![\displaystyle g(x_i) = \sqrt[N]{\prod\limits_{1}^{N} x_i} \equiv \frac{1}{g\left(\frac{1}{x_i}\right)}, \, x_i>0](https://s0.wp.com/latex.php?latex=%5Cdisplaystyle+g%28x_i%29+%3D+%5Csqrt%5BN%5D%7B%5Cprod%5Climits_%7B1%7D%5E%7BN%7D+x_i%7D+%5Cequiv+%5Cfrac%7B1%7D%7Bg%5Cleft%28%5Cfrac%7B1%7D%7Bx_i%7D%5Cright%29%7D%2C+%5C%2C+x_i%3E0&bg=ffffff&fg=000&s=0&c=20201002)
Harmonic mean: 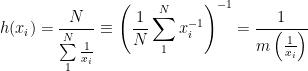
Applicability
In terms of the application of the Pythagorean means, there are differences in their usage due to their unique characteristics in capturing tendencies in data. Now, supposing the data 


One must be informed that the definition of the means implies that:

Several restrictions to keep in mind include:
- The arithmetic mean is heavily affected by outliers, and its performance is degraded when tackling non-Gaussian distribution data (e.g. data with multiple peaks, multi-modal probability distributions).
- The geometric mean only tackles positive values.
- The harmonic mean also works only with positive values of rates; in addition, it has a strong tendency towards the min value in the data.
Demonstration
To see how the Pythagorean means tackle “average” values in data a colab notebook was created, which explores how the means “behave” for simple cases like linear, exponential and Gaussian data.
The following figure shows an example of the location of the means on a graph showing linear data. The line equation used was 
![[1,101]](https://s0.wp.com/latex.php?latex=%5B1%2C101%5D&bg=ffffff&fg=000&s=0&c=20201002)
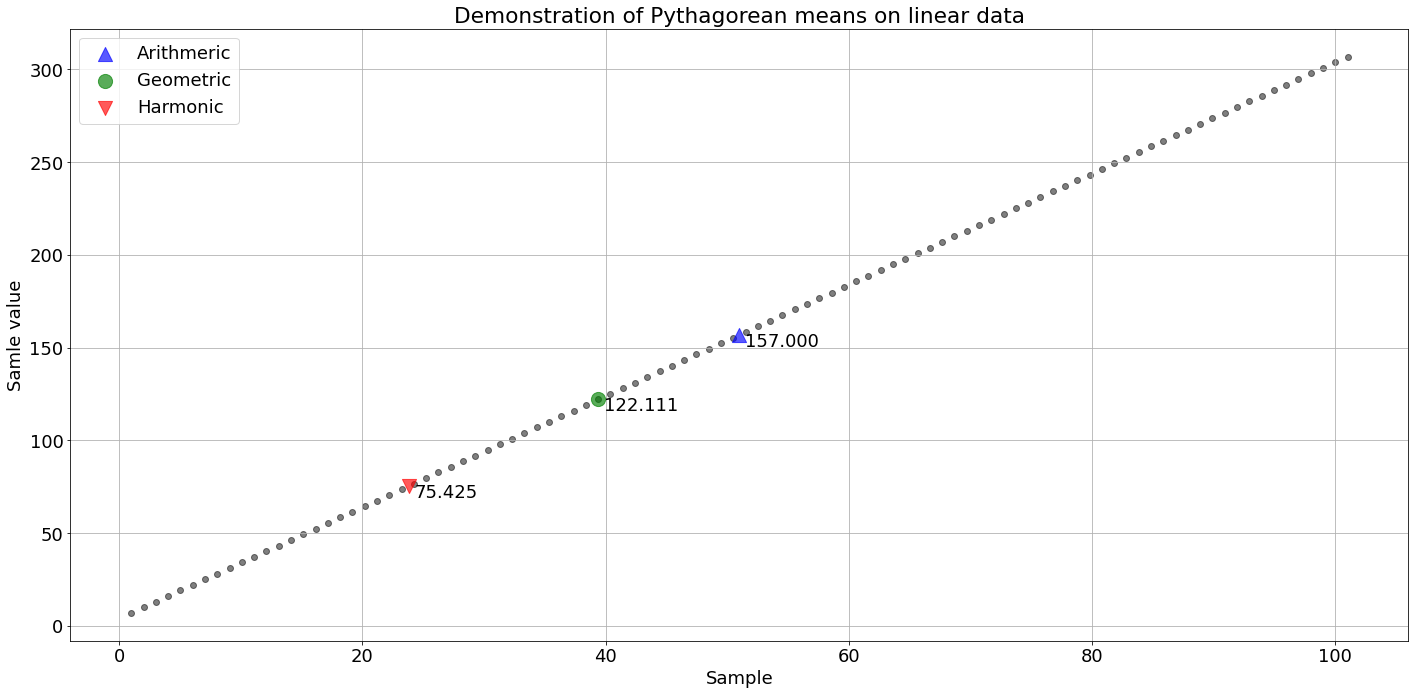
The following figure shows an example of the location of the means on a graph showing exponential data. The function used was 
![[1,11]](https://s0.wp.com/latex.php?latex=%5B1%2C11%5D&bg=ffffff&fg=000&s=0&c=20201002)
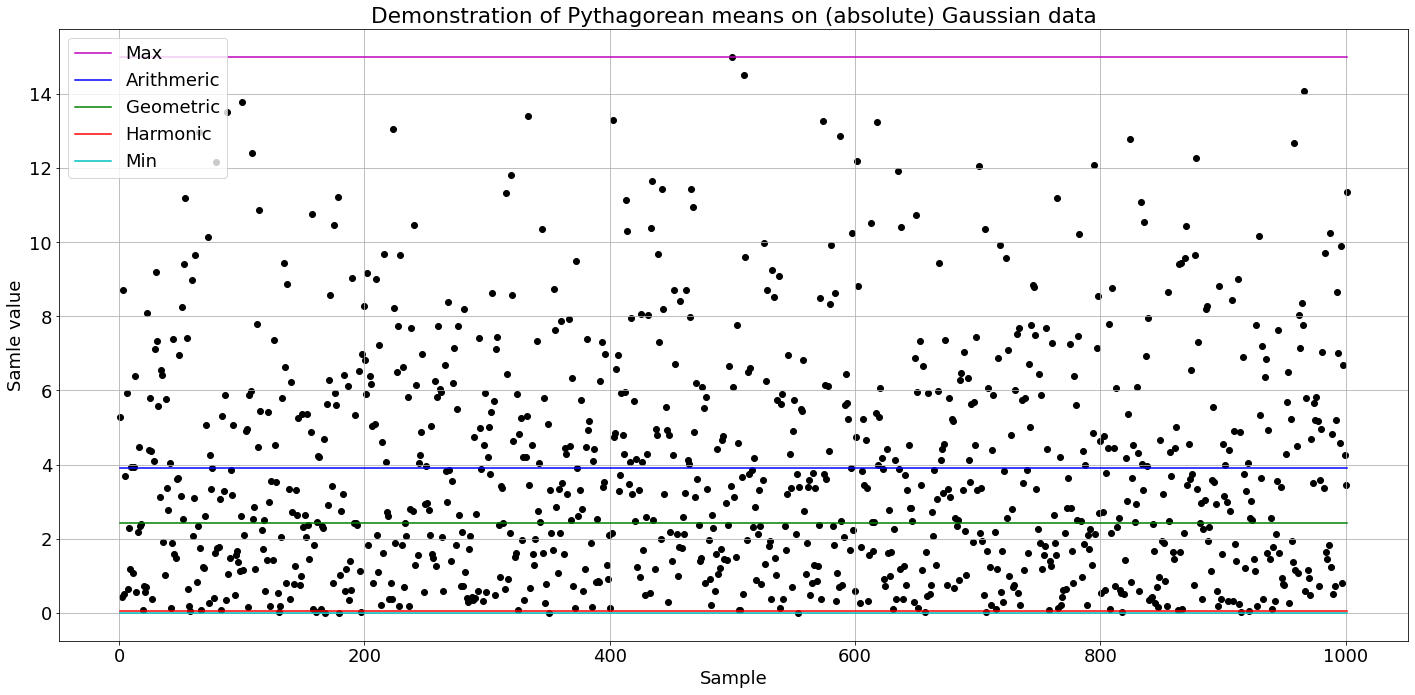
The following figure shows an example of the location of the means on a graph showing 1-D Gaussian data, with zero mean and standard deviation of 5, taken as absolute values to accommodate for the means that require positive values. 1000 samples were used in this case. The graph also shows the minimum and maximum.
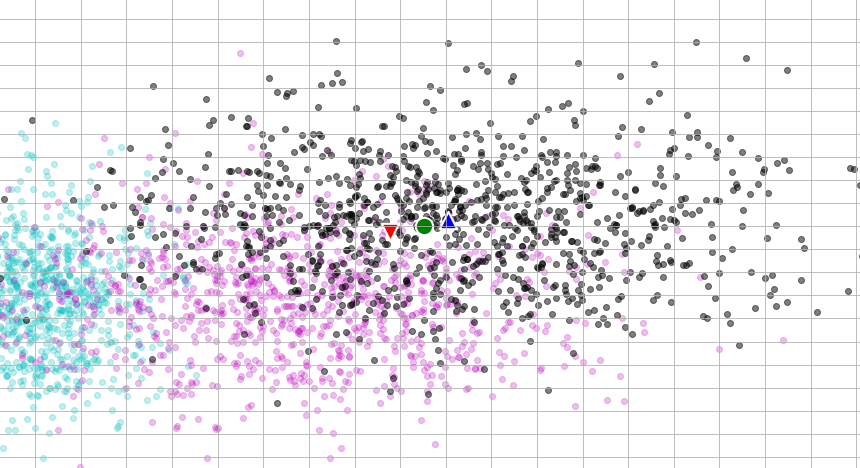
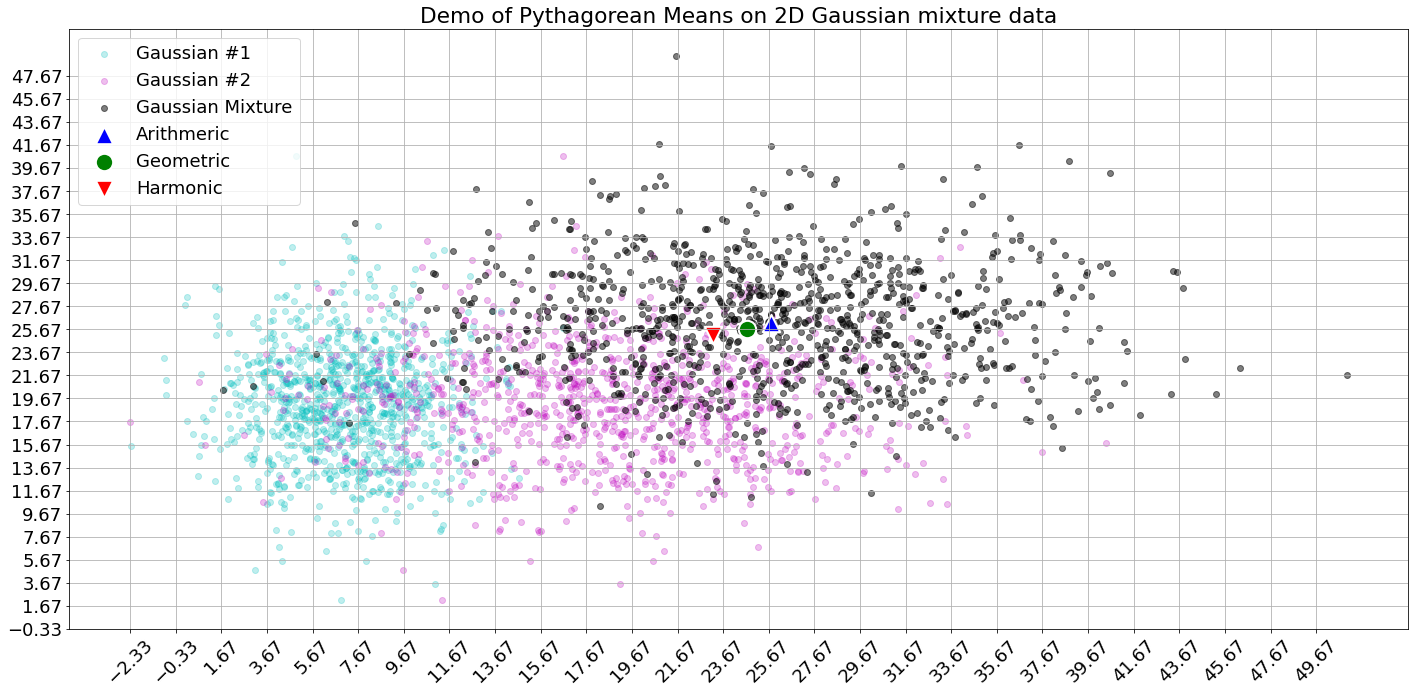
Last but not least, the following figure shows an example of the computation of the means on 2-D Gaussian mixture data, in which the two distributions are of the following characteristics:
- Gaussian #1:
with an offset of 7 and a scaling factor of 2
- Gaussian #2:
with an offset of 3 and a scaling factor of 4
Resources
There are a number of resources to consult regarding the Pythagorean means and here is just a list to begin exploring:
